Visualizing Missing Data and Detecting Outlier — Crucial Steps in Data Processing and Feature Engineering
https://github.com/whoisndu/visualise-missing-data-detect-outliers

I see a lot of comments from data analysts stating that feature engineering, cleaning, and pre-processing data is the most daunting part of their workflow. This has been the same with me for years, but I began incorporating some steps into my pre-processing procedures that significantly improved my workflow. This article will take you through these steps. The steps are:
Visualization of Missing Data and
Detection of Outliers in the Dataset
Let’s dive in.
Introduction
Data processing and feature engineering are critical stages in the data analysis pipeline, encompassing various techniques to prepare raw data for further analysis, modeling, and prediction. These steps are instrumental in ensuring the data's quality, reliability, and suitability in machine learning algorithms and statistical analyses. One of the essential aspects of data processing and feature engineering is handling missing data and identifying outliers.
Missing data refers to the absence of values in one or more data points, which can occur due to various reasons such as data collection errors, data entry issues, or simply the nature of the data source. Incomplete data can significantly impact the accuracy and validity of the analysis, leading to biased conclusions and erroneous predictions. Therefore, visualizing missing data and understanding its distribution across different variables is a crucial initial step in the data processing.
By visualizing missing data using techniques like heatmaps, data analysts and data scientists gain a clear overview of the completeness of the dataset, enabling them to make informed decisions about how to handle missing values. Depending on the extent and pattern of missing data, strategies like imputation (replacing missing values with estimates) or removal of incomplete observations may be employed. These approaches are essential for ensuring data integrity and preserving the representativeness of the data when building models or conducting statistical analyses.
Similarly, detecting outliers is essential to data processing, especially when dealing with numerical data. Outliers are data points that deviate significantly from the general pattern of the data, potentially indicating errors or rare events. Outliers can heavily influence statistical measures like the mean and standard deviation, leading to skewed and inaccurate results.
Identifying outliers is critical for multiple reasons:
Data Quality Assurance: Outliers often indicate data quality issues or anomalies in data collection, entry, or transmission. Detecting and addressing these outliers helps maintain the data's integrity and improves the overall quality of the dataset.
Robust Models: Outliers can adversely affect the performance and generalizability of machine learning models. Data scientists can create more powerful and reliable models better equipped to handle real-world scenarios by detecting and treating outliers.
Insight Generation: Sometimes, outliers may represent valuable insights or unique observations. However, not all outliers are informative, and distinguishing meaningful anomalies from data artifacts is essential for drawing meaningful conclusions from the data. For example, the dataset used here is a crime dataset and can be very sensitive to outlier exclusion as these are real crimes and real people. Thus, it is best to employ the techniques I am about to share as carefully and intuitively as possible.
Dataset Description
The dataset consists of various columns representing different attributes of crime incidents in Los Angeles. We will read the CSV file and perform an analysis to visualize the presence of missing data using Plotly.
About the Dataset
Dataset Name: Crime_Data_from_2020_to_Present - Los Angeles Crime Data 2020-2023.
Source: Original crime reports
Time: Starting from 2020
Python Packages Used
We begin by importing the necessary Python libraries used throughout the script. Each library serves a specific purpose in data handling, visualization, and outlier detection.
NumPy (imported as np): Powerful library for numerical computations in Python, supporting large, multi-dimensional arrays and matrices, along with high-level mathematical functions.
Pandas (imported as pd): Widely-used library for data manipulation and analysis in Python, introducing DataFrame and Series data structures to work with structured data like CSV files, spreadsheets, and databases.
Plotly.graph_objects (imported as go): Versatile library for creating interactive and visually appealing data visualizations, with support for various plot types, including heatmaps and boxplots.
Plotly.express (imported as px): High-level interface for quickly creating interactive visualizations with a concise syntax and intuitive API.
Scikit-learn IsolationForest: Popular machine-learning library in Python, implementing the Isolation Forest algorithm for outlier detection based on decision tree constructions.
Scikit-learn train_test_split: Function used for splitting data into training and testing sets, commonly used in machine learning workflows.
Pyculiarity detect_ts: Library for anomaly detection in time series data, providing methods like Twitter Anomaly Detection Algorithm (AD) and Seasonal Hybrid ESD (Extreme Studentized Deviate) Test.
heapq nlargest: Module for heap queue algorithm implementation, offering the nlargest function to retrieve the n largest elements from an iterable.
Statsmodels.tsa.seasonal seasonal_decompose: Library for time series analysis in Python, using the seasonal_decompose function for seasonal decomposition of time series data, revealing trends, seasonality, and residuals.
By importing these libraries at the beginning of the script, we ensure that we have access to the necessary tools and functionalities for handling data, creating visualizations, and performing outlier detection using the Isolation Forest algorithm. This sets the foundation for the subsequent steps in analyzing the crime dataset for the City of Los Angeles.
Visualizing Missing Data
Visualization of missing data can allow data analysts to quickly develop strategies to combat missing data points and successfully feature engineer data suited for predictive analysis or simple statistical analysis. In this case study, I use Plotly to create a heatmap of all columns in the dataset. Below is the resulting heatmap:
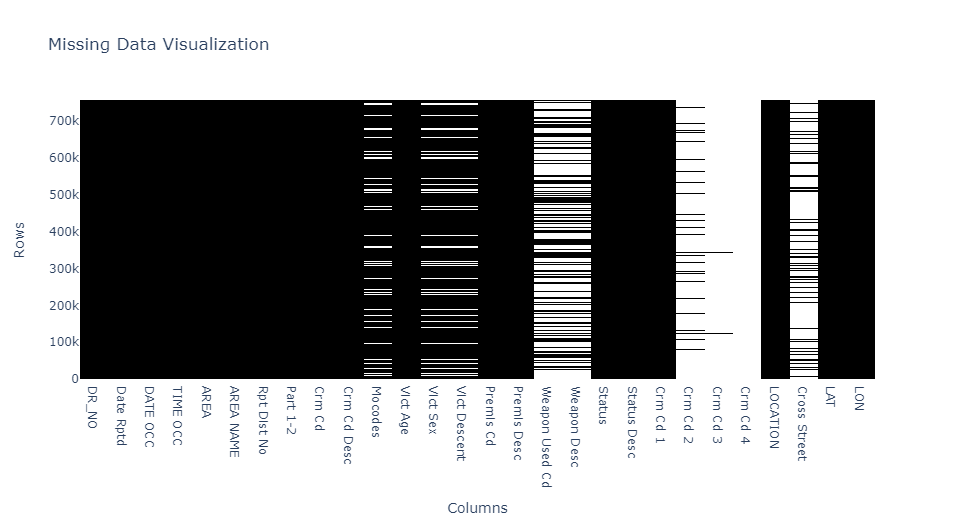
By glancing at this visualization, we can already see that the bulk of the work preprocessing this data would be in the columns named “Mocodes”, “Vict Sex”, “Vict Descent”, “Weapon Used CD”, “Weapon Desc”, “Crm Cd2”, “Crm Cd3”, “Crm Cd4”, “Cross Street”.
This visualization portrays the state of all data points across more than 700,000 rows contained in the initial dataset.
To achieve this, we create a heatmap using the Plotly library, which offers interactive and visually appealing data visualizations. The heatmap displays a black-and-white representation of missing data in the crime dataset.
First, we create a binary matrix called "binary_data" from the original crime dataset ("df") using the notnull() method. The binary matrix is a copy of the original dataset with a value of 1 in cells containing data and a value of 0 in cells with missing data (null values).
Next, we use the Plotly library to create the heatmap. We initialize a new Figure object named "fig" and create a Heatmap trace with the "binary_data" matrix.
To achieve the black-and-white representation, we customize the colorscale of the heatmap using the "colorscale" parameter. The color scale is defined as [[0, 'white'], [1, 'black']], where 0 represents white, and 1 represents black. As a result, cells with missing data (0 in "binary_data") will be displayed as white, and cells with data (1 in "binary_data") will be displayed as black.
Detection of Outliers
Outliers, also known as anomalies or extreme values, are data points that significantly deviate from the rest of the data in a dataset. Detecting outliers is a crucial step in data analysis and modeling, as these unusual data points can significantly impact the results, leading to biased conclusions or erroneous predictions. Outlier detection, also known as anomaly detection, is a data analysis technique used to identify rare and unusual observations or points that significantly differ from most data. Proper outlier detection helps improve the accuracy and reliability of data analysis, anomaly detection, and machine learning models. This write-up will explore various methods for detecting outliers and discuss their strengths and appropriate use cases. While there are different outlier detection techniques, I will use a combination of isolation forest algorithms, a known machine learning outlier detection technique, and other statistical outlier detection techniques. More of that is discussed on my GitHub here.
In this work, we illustrate three machine learning outlier detection techniques, namely:
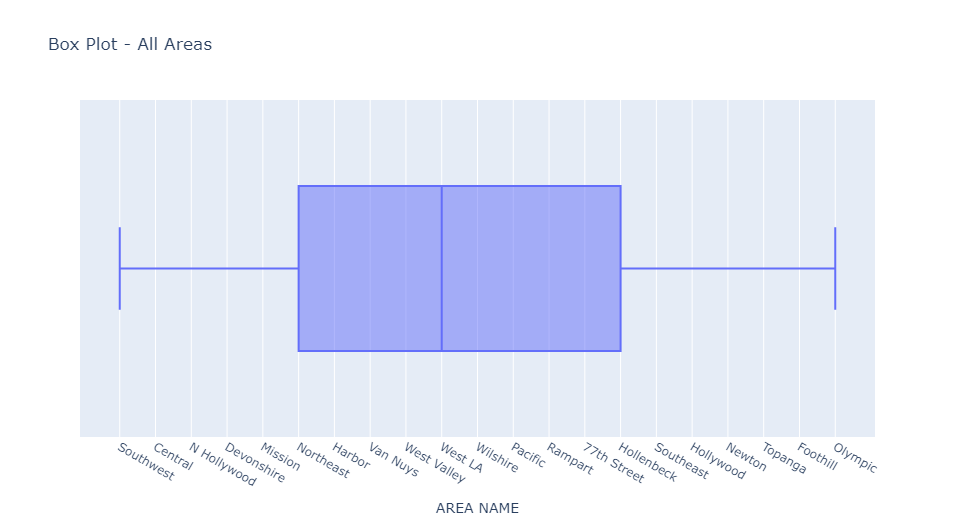
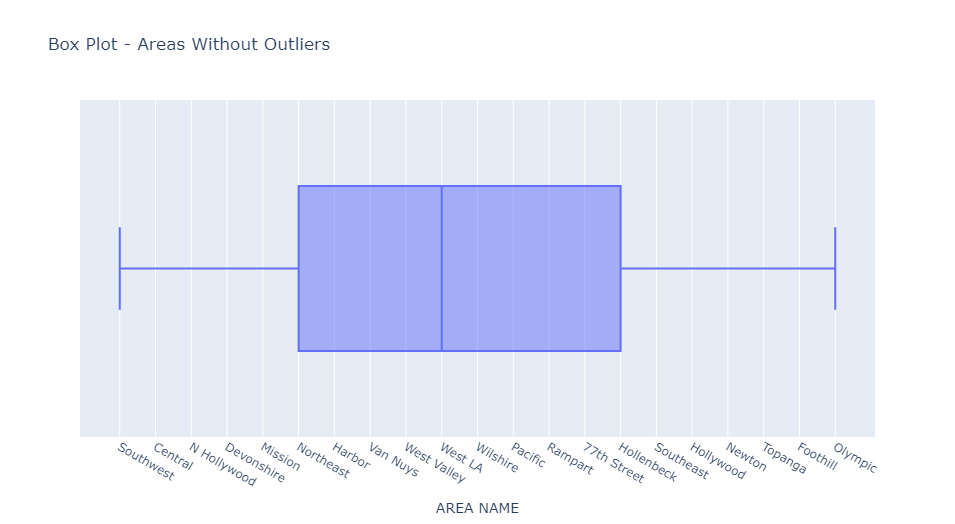
Detecting Outliers using Isolation Forest
Isolation forest is best used for numerical data. In this case, we applied the Isolation Forest algorithm to detect outliers in the “Area” and “Vict Age” columns as they contain numerical data suitable for use with the isolation forest algorithm. I go over this algorithm in my Jupyter Notebook. You can find that here.
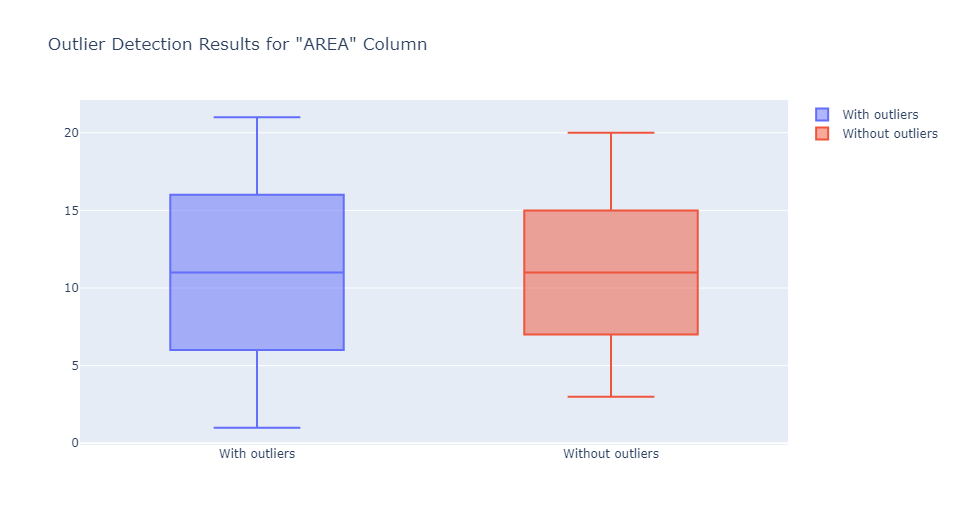
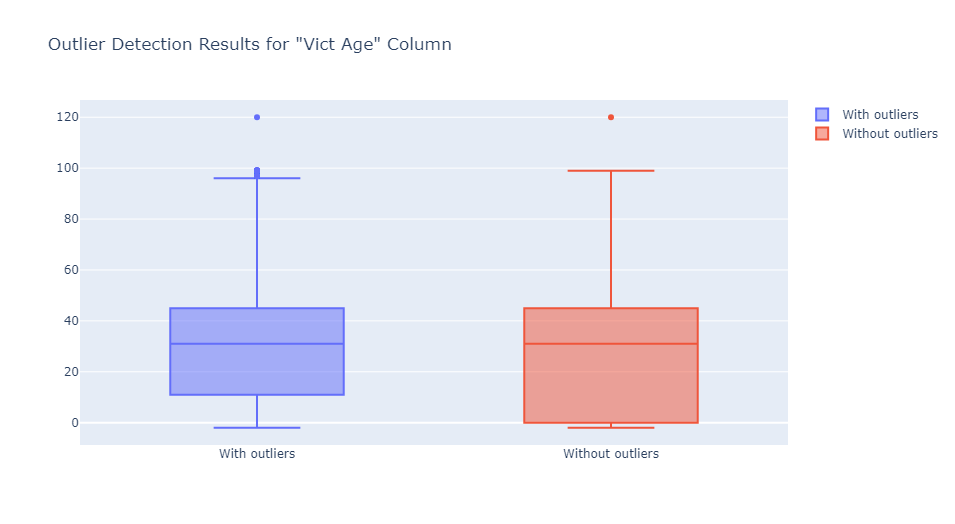
The images above show that the column “AREA” did not contain outliers. Still, the data was reshaped regardless, but the “Vict Age” column did, and these outliers were detected and promptly eradicated.
Some other forms of machine learning outlier detection techniques include Local Outlier Factor (LOF), One-Class SVM (Support Vector Machine), Autoencoder, k-Nearest Neighbors (k-NN), DBSCAN (Density-Based Spatial Clustering of Applications with Noise), HBOS (Histogram-Based Outlier Score), and Local Correlation Integral (LOCI).
Detecting Outliers Using Seasonal Hybrid ESD Test
This machine learning method is used to identify anomalies in datasets containing time or seasonal data. I used the “Date Rptd” column to illustrate this point since that is the column that includes dates, and the result is as shown below:
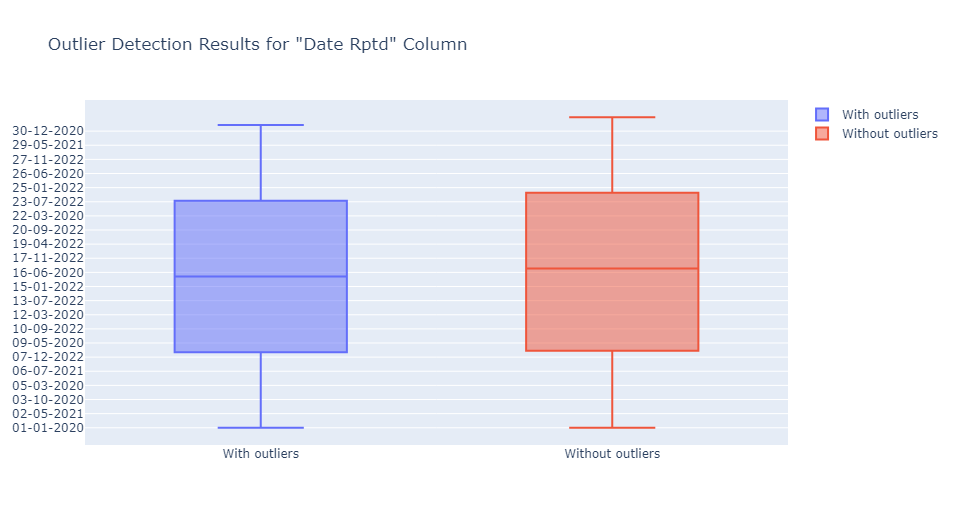
The “Date Rptd” column did not contain outliers; however, the data was reshaped.
Outlier Detection in Categorical Data Based on Frequency Distributions.
Detecting outliers by frequency distributions is especially useful for detecting outliers in categorical variables. In this case, the column “Area Name” is the most suitable for illustrating this point as it contains categorical variables used to identify where a crime was committed. Below is the result of the outlier detection:
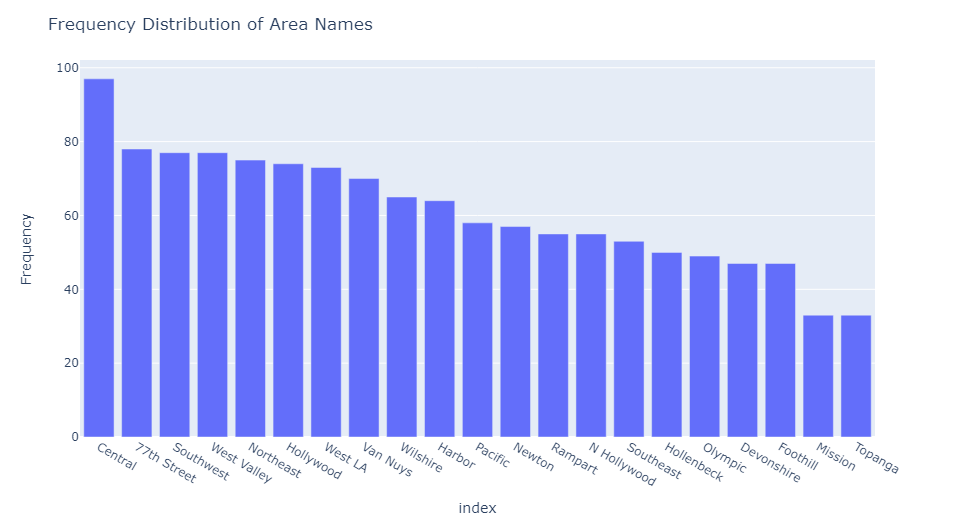
No outliers were in the “Area Name” column, so the data was essentially unchanged.
Some other methods of statistical detection of anomaly include Z-score and modified Z-score.
Conclusion
In conclusion, data processing and feature engineering are critical stages in the data analysis pipeline that are crucial in preparing raw data for analysis and modeling. Within these stages, handling missing data and identifying outliers are essential steps that significantly impact the quality and accuracy of the analysis.
Visualizing missing data allows data analysts to comprehensively understand the dataset's completeness, aiding in informed decisions about handling missing values. Techniques like heatmaps help identify columns with a higher concentration of missing data, enabling data scientists to devise appropriate strategies such as imputation or removal of incomplete observations.
Detecting outliers is equally essential, as these unusual data points can skew statistical measures and affect the performance of machine learning models. We can effectively identify outliers in numerical and time-based data using machine learning techniques like Isolation Forest and Seasonal Hybrid ESD Tests, respectively. Additionally, analyzing frequency distributions aids in detecting outliers in categorical variables, contributing to a more robust analysis.
However, it is crucial to approach outlier detection with care, especially in sensitive datasets such as crime data, where anomalies can represent genuine occurrences. Distinguishing meaningful anomalies from data artifacts is essential to ensure that our conclusions and predictive models are based on reliable and representative data.
These techniques provide a solid foundation for further exploration and analysis, helping data analysts and scientists make better-informed decisions and draw meaningful conclusions from the data. As we refine our approach and leverage advanced methods, data processing and feature engineering will become more efficient, ensuring the accurate and reliable analysis of complex datasets in diverse domains.